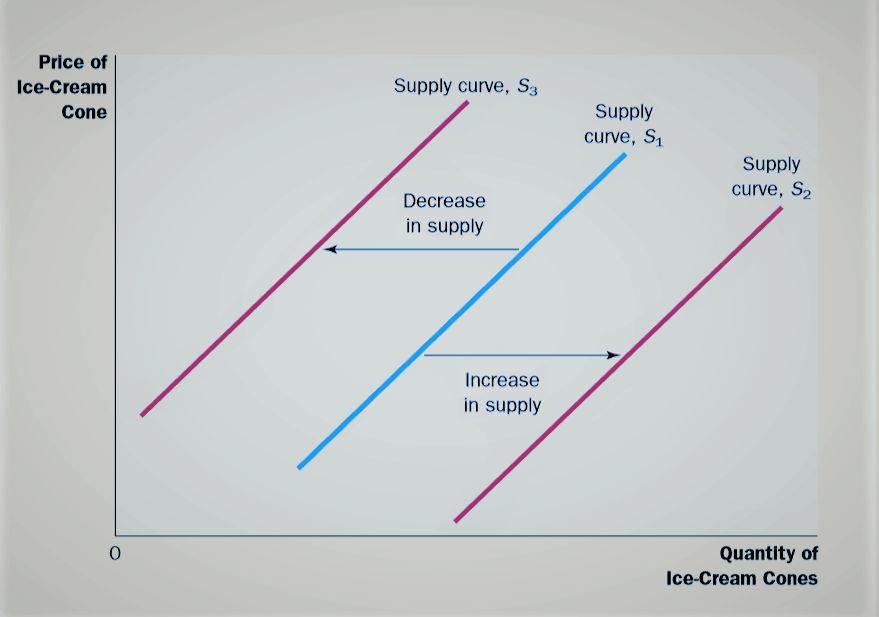
shifts in the supply curve change, Whenever there is a change in any determinant of supply, other than the good’s price, the supply curve shifts.
Any change that raises quantity supplied at every price shifts the supply curve to the right. Similarly, any change that reduces the quantity supplied at every price shifts the supply curve to the left.
Example
Suppose that the price of sugar falls. How does this change affect the supply of ice cream?
Because sugar is an input into producing ice cream, the fall in the price of sugar makes selling ice cream more profitable.
This raises the supply of ice cream: At any given price, sellers are now willing to produce a larger quantity.
Thus, the supply curve for ice cream shifts to the right.
Whenever there is a change in any determinant of supply, other than the good’s price, the supply curve shifts.

Any change that raises the quantity that sellers wish to produce at a given price shifts the supply curve to the right. Any change that lowers the quantity that sellers wish to produce at a given price shifts the supply curve to the left.
DETERMINANTS OF QUANTITY SUPPLIED

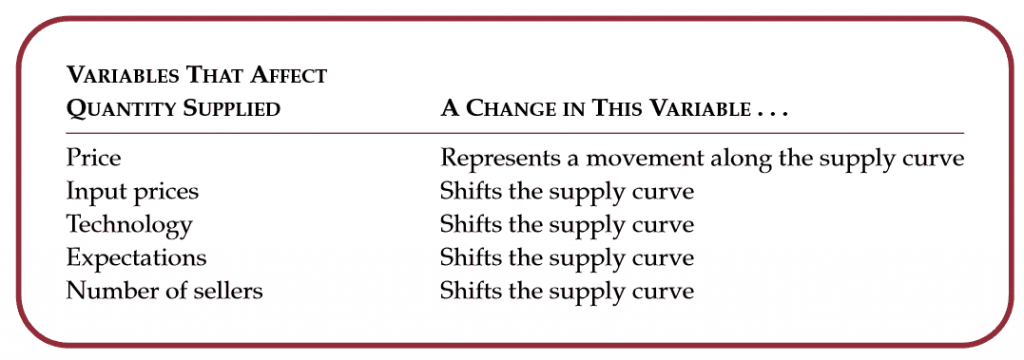
Above table shows, any change that raises quantity supplied at every price shifts the supply curve to the right. Similarly, any change that reduces the quantity supplied at every price shifts the supply curve to the left.
Table lists the variables that determine the quantity supplied in a market and how a change in the variable affects the supply curve. Once again, price plays a special role in the table.
Because the price is on the vertical axis when we graph a supply curve, a change in price does not shift the curve but represents a movement along it.
By contrast, when there is a change in input prices, technology, expectations, or the number of sellers, the quantity supplied at each price changes; this is represented by a shift in the supply curve.
Summary of Shifts in the Supply Curve
The supply curve shows what happens to the quantity supplied of a good when its price varies, holding constant all other determinants of quantity supplied. When one of these other determinants changes, the supply curve shifts.
