The aggregate supply curve represents the entire quantity of goods and services that companies produce and sell at any given price level.
Unlike the aggregate demand curve, which is always downward sloping, the aggregate supply curve shows a relationship that depends crucially on time.
In the long term, the aggregate supply curve is vertical; On the other hand, in the short run, the aggregate supply curve is upward sloping.
To understand short-run economic variations, and how the short-run performance of the economy deviates from its long-run behavior, we need to examine both the long-run aggregate-supply curve and the short-run aggregate supply curve.
Why Aggregate Supply Curve is vertical in the long run
What defines the number of goods and services supplied in the long-run?
In the long-run, an economy’s total production of goods and services (real GDP) depends on its supplies of capital, natural resources, labour, and technology used to turn these factors of production into goods and services.
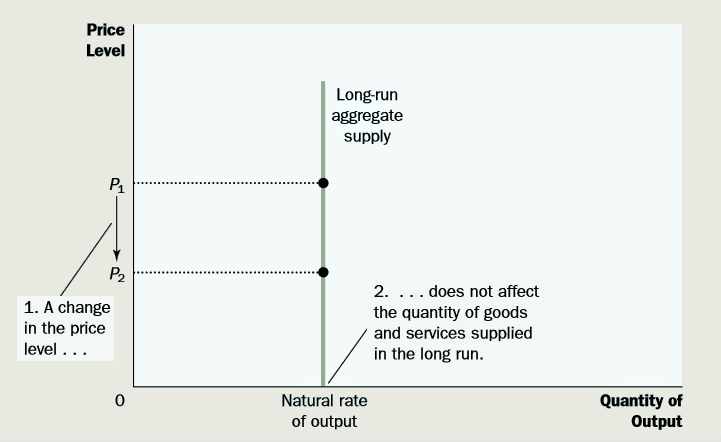
Because the price-level does not affect long-run factors of real GDP, the long-run aggregate supply curve is vertical, as shown in the graph below.

In simple words, in the long run, the economy’s labour, capital, natural resources, and technology define the total quantity of goods and services supplied, and this quantity supplied is the same regardless of what the price level is.
The vertical long-run aggregate supply curve is, in essence, just an application of the classical dichotomy and monetary neutrality.
Classical macroeconomic theory is based on the premise that real variables do not depend on nominal variables.
The long-run aggregate supply curve is consistent with this concept because it indicates that the quantity of output (a real variable) does not depend on the level of prices (a nominal variable).
Economists also believe that this principle works well when studying the economy for many years, but not for short-term or when studying year to year changes.
Therefore, the aggregate supply curve is vertical exclusively in the long run.
You might question why supply curves for specific goods and services can be upward sloping if the long-run aggregate supply curve is vertical.
The reason is that the supply of particular goods and services depends on relative prices, the prices of these goods and services compared to other prices in the economy.
For example, when the price of bread increase, suppliers or bakers increase their production, taking labor, flour, Yeast, and other inputs away from the output of other products, such as Cakes.
By contrast, the economy’s overall production of goods and services is limited by its labor, capital, natural resources, and technology.
Thus, when all prices in the economy increase simultaneously, there is no change in the overall quantity of goods and services supplied.
WHY THE LONG-RUN AGGREGATE SUPPLY CURVE MIGHT SHIFT?
The position of the long-run aggregate supply curve demonstrates the quantity of goods and services predicted by classical macroeconomic theory.
This level of production is known as potential output or full-employment output.
To be more specific, we call it the natural rate of output because it explains what the economy produces when unemployment is at its natural rate. The natural rate of production is the level of the production toward which the economy drifts in the long run.
Any shift in the economy that alters the natural rate of output also shifts the long-run aggregate supply curve.
Because production in the classical model depends on capital, natural resources, labour, and technological knowledge, we can classify shifts in the long-run aggregate supply curve as arising from these sources.
1 Shifts Arising from Labour
Imagine a scenario, where an economy undergoes an increase in immigration. Because there would be a higher number of workers, the quantity of goods and services supplied would grow as well.
As a result, the long-run aggregate supply curve would move to the right.
On the flip side, if many workers left the economy to work in other countries, the long run aggregate supply curve would shift towards left.
The position of the long-run aggregate supply curve also depends on the natural rate of unemployment, so any variation in the natural rate of unemployment shifts the long-run aggregate supply curve.
For instance, if the Government raise the minimum wages heavily, the natural rate of unemployment will also increase, and the economy would output a lower quantity of goods and services.
This increase in wages will cause, the long-run aggregate supply curve to shift towards left.
On the other hand, if a govt lower or stops the assistance to unemployment labor, it will encourage unemployed workers to seek harder for new jobs, the natural rate of unemployment would drop, and the long-run aggregate supply curve would shift to the right.
2 Shifts Arising from Capital
An increase in the economy’s capital stock increases productivity and, thereby, the quantity of goods and services supplied.
As a result, the long-run aggregate supply curve shifts to the right. Conversely, a decrease in the economy’s capital stock decreases productivity and the quantity of goods and services supplied, shifting the long-run aggregate-supply curve to the left. Notice that the same logic applies regardless of whether we are discussing physical capital or human capital.
An increase either in the number of machines or in the number of college degrees will raise the economy’s ability to produce goods and services.
Thus, either would shift the long-run aggregate supply curve to the right.
3 Shifts Arising from Natural Resources
Natural resources are a crucial part of the economy’s production which includes raw minerals, land, and weather.
A boost in the output of minerals from mines shifts the long-run aggregate supply curve to the right.
Consequently, change in weather patterns that make farming more challenging shifts the long-run aggregate supply curve to the left.
Almost all countries, import some kind of natural resources from other countries. A change in the supply of these resources or the relationship between the two countries can shift the aggregate supply curve.
4 Shifts Arising from Technological Knowledge
The most significant reason that the economy today produces more than it did a couple of decades ago is that our technological expertise has improved.
The invention of the robots, for instance, has allowed us to make more cars from any given amounts of labor, capital, and natural resources.
Hence, this technological advancement has shifted the long-run aggregate supply curve to the right.
On the flip side, if the government passed new regulations restricting firms from using some production methods, maybe because they were too bad for the environment the result would move the long-run aggregate-supply curve to the left.
WHY THE AGGREGATE SUPPLY CURVE SLOPES UPWARD IN THE SHORT RUN?
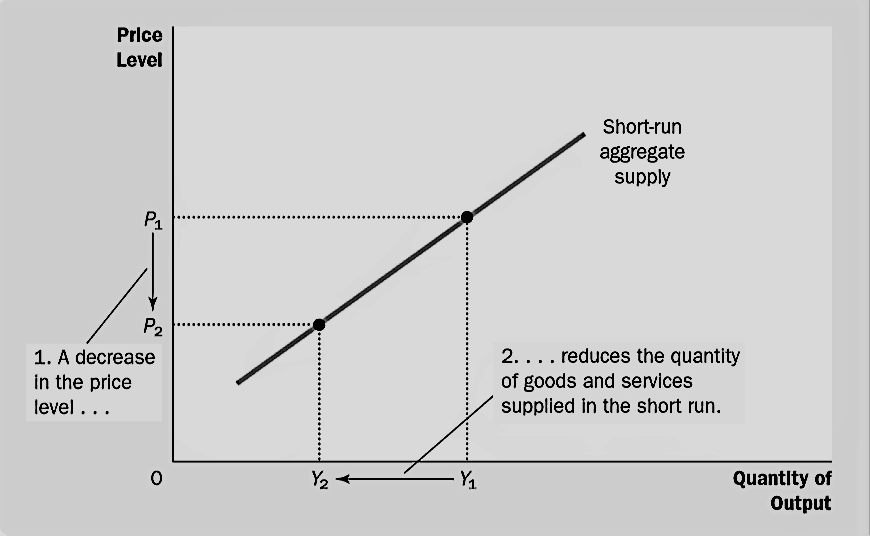
in the short run, the aggregate supply curve is upward sloping, as displayed in an image below.

The short‐run is the period that begins immediately after an increase in the price level, and that ends when input prices have increased in the same proportion to the rise in the price level.
Which is usually throughout a year or two, An increase in the overall level of prices in the economy tends to raise the quantity of goods and services supplied, and a drop in the level of prices tends to decrease the quantity of products and services provided.
What causes this positive relationship between the price level and output?
Economists have proposed three theories for the upward slope of the short-run aggregate supply curve.
In every theory, a specific market flaw causes the supply side of the economy to behave differently in the short run as compared to the long term.
Although each of the following theories is different in detail, they share a common idea: The quantity of output supplied deviates from its long run, or “natural,” level when the price level differs from the price level that market expected.
When the price level soars above the expected level, output rises above its natural rate, and when the price level falls below the expected level, production falls below its natural rate as well.
1 The Misperceptions Theory
According to Misperceptions theory, changes in the overall price level can temporarily trick suppliers about what is happening in the individual markets in which they trade their production.
As a result of these short-run misperceptions, suppliers react to changes in the level of prices, and this response leads to an upward-sloping aggregate supply curve.
To understand this, Imagine the overall price level falls below the level that people expected.
When suppliers see the prices of their products fall, they may mistakenly believe that their relative prices have fallen.
For example, Iceream makers may notice a drop in the price of Icecream before they see a fall in the costs of the many items they buy as consumers.
They may infer from this observation that the reward for producing Icecream is temporarily low, and they may respond by reducing the quantity of Icecream they supply.
In such a scenario, a lower price level causes misperceptions about relative prices, and these misperceptions induce suppliers to react to the lower price level by reducing the quantity of goods and services they supply.
2 The Sticky Wage Theory
According to the Sticky Wage theory, the short-run aggregate supply curve slopes upward because nominal wages are slow to adjust, or in other words are “sticky,” in the short run.
To some degree, the slow adjustment of nominal wages is attributable to long-term contracts between workers and firms that fix nominal wages, sometimes for as long as three years.
To understand sticky nominal wages in context to aggregate supply,
Suppose that a company has agreed to pay its workers a certain nominal salary after certain months based on what company anticipated the price level to be.
If the price level falls below that was expected by the company, and the nominal wage remains the same, then the real wage rises above the level the company planned in the budget to pay.
Because wages are a big part of a firm’s production expenses, higher salaries mean that the firm’s actual prices have increased.
The firm responds to these higher costs by hiring less labor and producing a smaller quantity of goods and services.
In other words, because wages do not adjust immediately to the price level, a lower price level makes employment and production less profitable, which induces firms to reduce the quantity of goods and services supplied.
3 The Sticky Price Theory
Some economists have promoted a third approach to the short-run aggregate supply curve, called the sticky-price theory.
As we just discussed, the sticky-wage theory insists that nominal wages adjust slowly over time.
The sticky price theory stresses that the prices of some goods and services also adjust slowly in response to changing economic circumstances.
Slow adjustment of prices happens in part because there are expenses to adjusting prices, called menu costs.
Menu costs comprise the cost of printing and distributing catalogs and the time required to change price tags. Because of these expenses, prices, as well as wages, maybe sticky in the short run.
