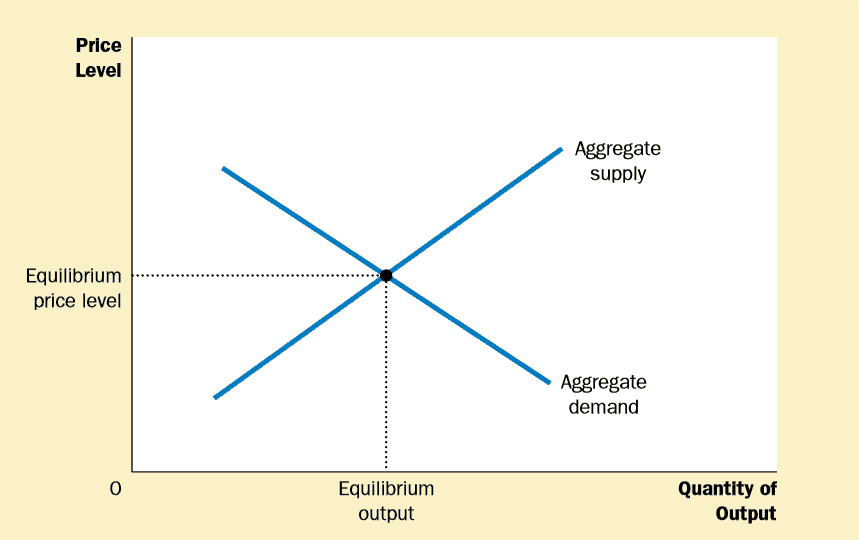
The aggregate demand curve represents the quantity of all goods and services demanded in the economy at any given price level.
In many ways, its aggregate demand looks similar to traditional demand and supply, but aggregate demand and traditional demand are two different things.
In aggregate demand, we plot on the horizontal axis, not just the quantity bought or sold of one good or service in an amount of time; but the actual production of the economy in a given period.

On the horizontal axis is the economy’s total output of goods and services. Output and the price level adjust to the point at which the aggregate-supply and aggregate-demand curves intersect.
The total production of the economy in a given period is known as real GDP.
In Y-axis, we plot price level; This is not prices for one good or service, this is the general level of prices in the economy.

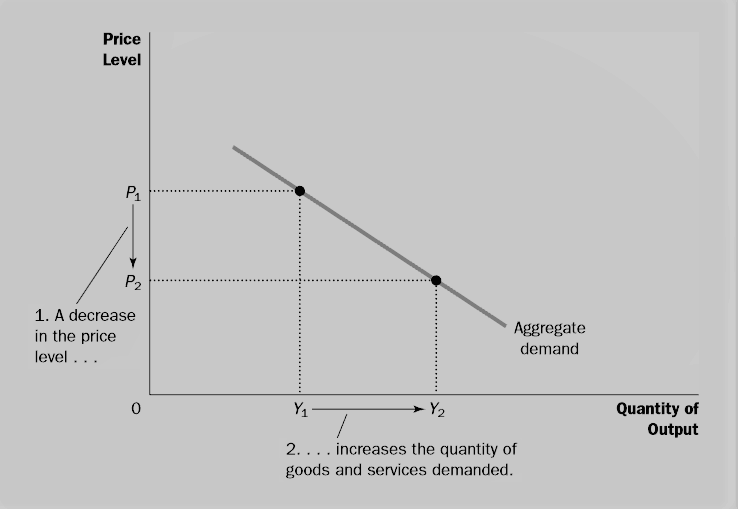
The aggregate demand curve is downward sloping. It means that other things equal, a fall in the economy’s overall level of prices (from, say, P1 to P2) tends to raise the number of goods and services demanded (from Y1 to Y2).
WHY THE AGGREGATE DEMAND CURVE SLOPES DOWNWARD
If you remember, GDP is the sum of consumption, investment, government purchases, and net exports. (Y = C + I + G + NX)
All 4 GPD components contribute to the aggregate demand for goods and services.
For now, we pretend that by policy government spending is fix.
The other three components of spending are—consumption, investment, and net exports—depend on economic conditions and, in particular, at the price level.
To read why the downward slope of the aggregate-demand curve, therefore, we must examine how the price level affects the quantity of goods and services demanded consumption, investment, and net exports.
There are three essential theories why economists believe that there is a downward sloping aggregate demand curve. The first is called the “wealth effect.”
1 The Price Level and Consumption: The Wealth Effect
The Wealth Effect take into account the money that you hold in your savings.
The nominal value of this money is the same, but its real value is not.
When Everything else in the economy is the same,
• Employment has not changed.
• Profits have not changed.
• People’s optimism has not changed.
The single thing that is different is the prices of everything in the economy drops.
When prices fall, people can buy more goods and services with the same amount of money.
Thus, a decrease in the price level makes consumers feel wealthier, which in turn encourages them to spend more money.
The increase in consumer spending leads to a larger quantity of goods and services demanded.
Similarly, if for any reason people woke up the next morning, and the price of everything was to double. Everything will be expensive. People will have to buy less of everything. Moreover, demand fewer goods and service.
2 The Price Level and Investment: The Interest-Rate Effect
The price level is one factor of the quantity of money demanded. The cheaper the price level, the fewer money households need to hold to buy the goods and services they want.
When the price level falls, therefore, households try to reduce their holdings of money by lending some of it out.
For instance, a household might use its excess money to buy interest-bearing bonds. Alternatively, it might deposit its excess cash in an interest-bearing savings account, and the bank would use these funds to make more loans.
In either case, as households try to convert some of their money into interest-bearing assets, they drive down interest rates.
Lower interest rates, in turn, encourage borrowing by firms that want to invest in new plants and equipment and by households who wish to invest in new housing.
Thus, a lower price level reduces the interest rate, encourages greater spending on investment goods, and thereby increases the number of products and services demanded.
3 The Price Level and Net Exports: The Exchange-Rate Effect
Any situation that changes net exports for a given price level also shifts aggregate demand. For example, when Europe experiences a recession, it buys fewer goods from the United States.
Fewer sales reduce U.S. net exports and shifts the aggregate-demand curve for the U.S. economy to the left.
When Europe recovers from its recession, it starts repurchasing U.S. goods, shifting the aggregate-demand curve to the right.
Net exports sometimes change because of movements in the exchange rate.
for instance, If for some reason the dollar weakens relative to other currencies, then American goods and services are going to appear to be cheaper to people in England.
For example, if a company make a laptop in America for $1,000, maybe $1,000 before all currency devalued, translates into 5,00 euros, but after the dollar has weakened. Now $1,000 is going to convert into 4,00 euros.
Europeans will think that American laptops just got cheaper when we view it in context to euros.
More people will be willing to buy American laptops which will increase the America export, and increase sales will contribute to higher GDP for America.
That’s main reason why China is always trying to devalue its currency in recent years.
When currency is cheaper, it makes goods and services less expensive to the rest of the world. So it makes net exports increase.
Once again, when you have a low-price level, you could have GDP expanding. Naturally, if the prices were to increase, the opposite dynamic might occur.
Suppose, for instance, that international speculators bid up the value of the U.S. dollar in the market for foreign-currency exchange.
This appreciation of the dollar would make U.S. goods more expensive compared to foreign products, which would depress net exports and shift the aggregate-demand curve to the left.
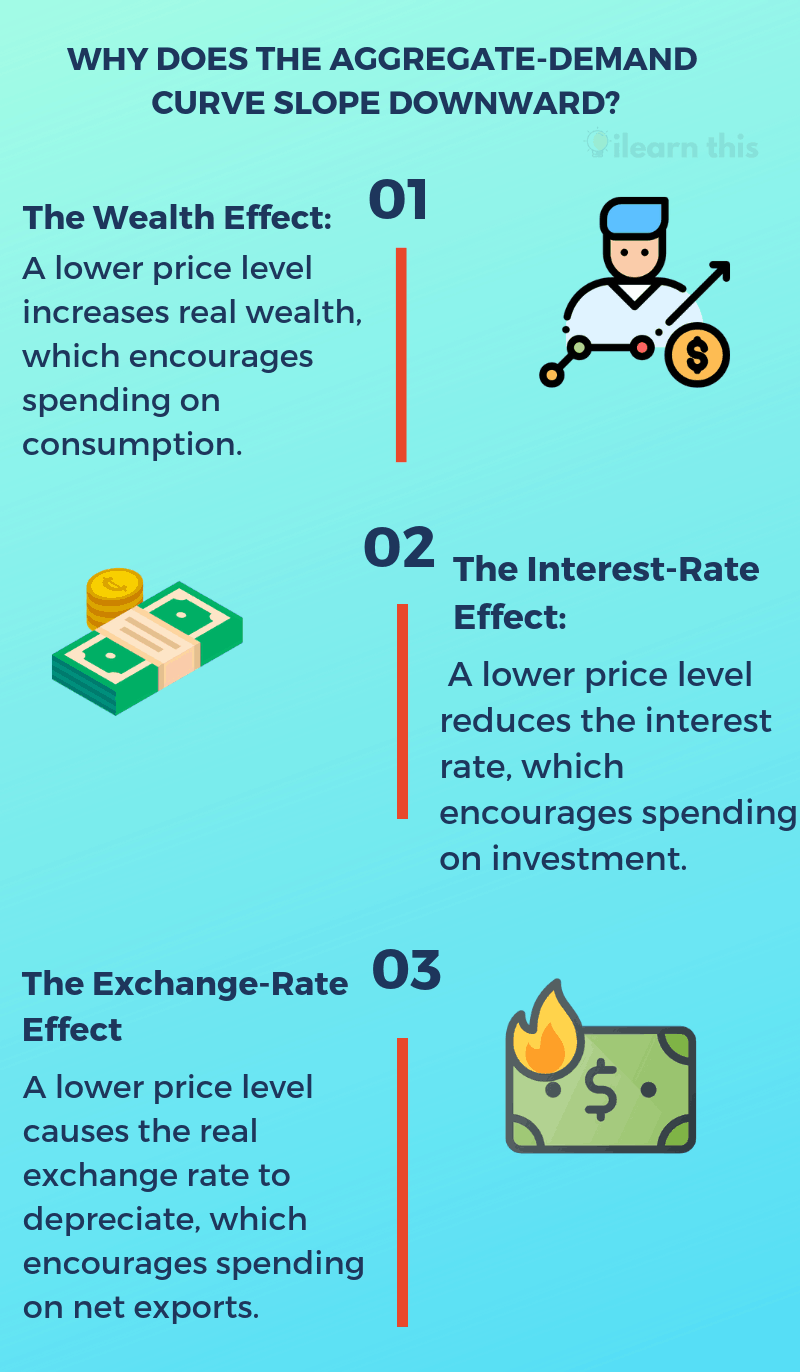
The graph below sums up Why Aggregate Demand Curve Slopes Downward.

Why Aggregate Demand Curve Slopes Downward.
Summary
There are, 3 different but related reasons why a fall in the price level increases the quantity of goods and services demanded:
Consumers feel wealthier, which stimulates the demand for consumption goods.
Interest rates fall, which stimulates the demand for investment goods.
The exchange rate depreciates, which stimulates the demand for net exports.
For all three reasons, the aggregate-demand curve slopes downward. It is crucial to keep in mind that the aggregate-demand curve (like all demand curves) is drawn holding “other things equal.”
In particular, our three explanations of the downward-sloping aggregate-demand curve assume that the money supply is fixed.
That is, we have been considering how a change in the price level affects the demand for goods and services, holding the amount of money in the economy constant.
As we will see, a change in the quantity of money shifts the aggregate-demand curve. At this point, just keep in mind that the aggregate-demand curve is drawn for a given quantity of money.
