Law of Demand says if we raise the price of a product, it will lower the quantity demanded of the product means Quantity demanded will go down.
Law of Demand
Law of Demand says if we raise the price of a product, it will lower the quantity demanded of the product means Quantity demanded will go down.
On the flip side, If we lower the price of a product, that will raise the quantity demanded of that product. Though there are some exceptions to this.
Please Note: when we talk about the word demand in a formal economic sense, we’re not talking about a quantity. If we talk about an actual quantity, we should say the “quantity demanded”.
Quantity and Quantity demanded are two different things.
And if it’s a little confusing to you right now, hopefully by the end of this article, the difference between demand and quantity demanded will become a little bit clearer to you.
Demand schedule
Demand Schedule is a table that shows the relationship between the price of a good and the quantity demanded.
| PRICE OF ICE-CREAM CONE | QUANTITY OF CONES DEMANDED |
| $0.00 | 12 |
| $0.50 | 10 |
| $1 | 8 |
| $1.50 | 6 |
| $2.00 | 4 |
| $2.50 | 2 |
| $3.00 | 0 |
Above table shows how many ice-cream cones Catherine buys each month at different prices of ice cream.
If ice cream is free, Catherine eats 12 cones. At $0.50 per cone, Catherine buys 10 cones.
As the price rises further, she buys fewer and fewer cones. When the price reaches $3.00, Catherine doesn’t buy any ice cream at all.
This table represents the
Demand curve
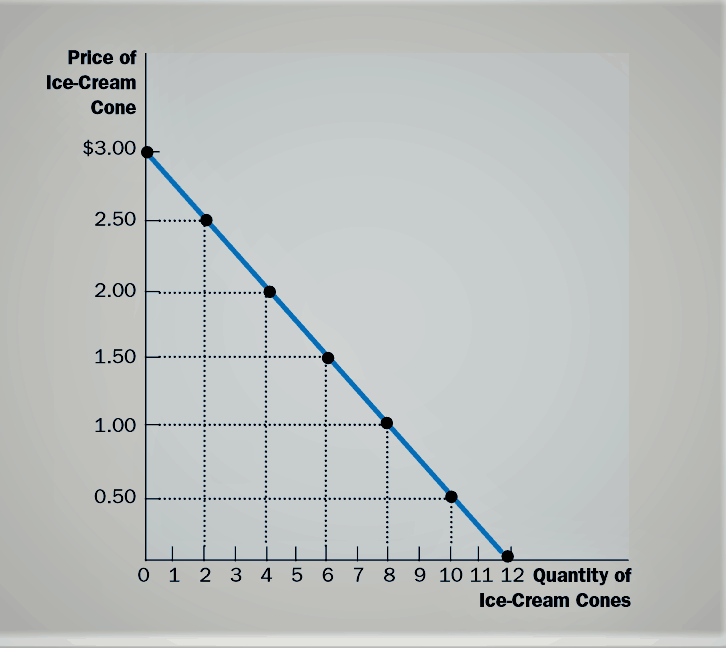
A demand curve is a graph of the relationship between the price of a good and the quantity demanded.
Let’s graphs the numbers shown in the demand schedule table above.
By convention, the price of ice cream is on the vertical axis, and the quantity of ice cream demanded is on the horizontal axis.
The downward-sloping line relating price and quantity demanded is called the demand curve.

WHAT IS CETERIS PARIBUS
Whenever you see a demand curve, remember that it is drawn holding many things constant.
Catherine’s demand curve in above icecream example shows what happens to the quantity of ice cream Catherine demands when only the price of ice cream varies.
The curve is drawn assuming that Catherine’s income, tastes, expectations, and the prices of related products are not changing.
Economists use the term ceteris paribus to signify that all the relevant variables, except those being studied at that moment, are held constant.
The Latin phrase literally means “other things being equal.”
The demand curve slopes downward because, ceteris paribus, lower prices mean a greater quantity demanded.
Although the term ceteris paribus refers to a hypothetical situation in which some variables are assumed to be constant, in the real world many things change at the same time.
For this reason, when we use the tools of supply and demand to analyze events or policies, it is important to keep in mind what is being held constant and what is not.
What are Exceptions to the law of demand?
Basically, there are some goods where the law of demand doesn’t apply and these are exceptions. some are listed below.
- Necessity goods like Medicines, Food, Gasoline
- Addicted items like drugs and liquor
- Unique/antique items like vintage cars etc
- Giffen goods
Quantity vs Quantity demanded?
Quantity is all of the product being made. Quantity demand is the amount demanded by people buying the product at the said price.
In order to understand quantity vs quantity demanded.
Let’s consider the company makes 20,000 cars. 20,000 cars are the quantity.
And, if Only 10,000 people want to buy the car. The quantity demand is 10,000.
The quantity demand can change if the car is sold at a cheaper price or a more expensive price.
