The dictionary defines the word equilibrium as a situation in which various forces are in balance—and this also describes a market equilibrium.
At the equilibrium price, the quantity of the good that buyers are willing and able to buy exactly balances the quantity that sellers are willing and able to sell.
The equilibrium price is sometimes called the market-clearing price because, at this price, everyone in the market has been satisfied: Buyers have bought all they want to buy, and sellers have sold all they want to sell.

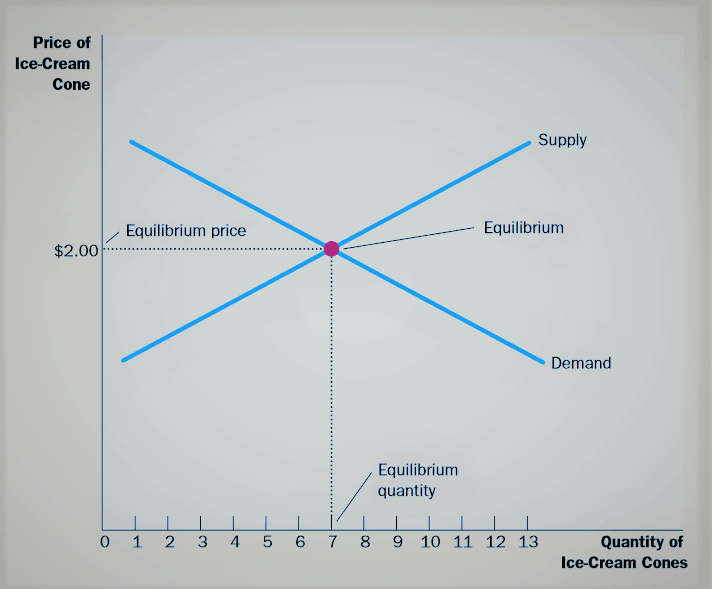
The graph above shows the market supply curve and market demand curve together.
Notice that there is one point at which the supply and demand curves intersect; this point is called the market’s equilibrium.
The price at which these two curves cross is called the equilibrium price, and the quantity is called the equilibrium quantity.
Here the equilibrium price is $2.00 per cone, and the equilibrium quantity is 7 ice-cream cones.
Breaking down Market Equilibrium
The actions of buyers and sellers naturally move markets toward the equilibrium of supply and demand. To see why consider what happens when the market price is not equal to the equilibrium price.
Example One
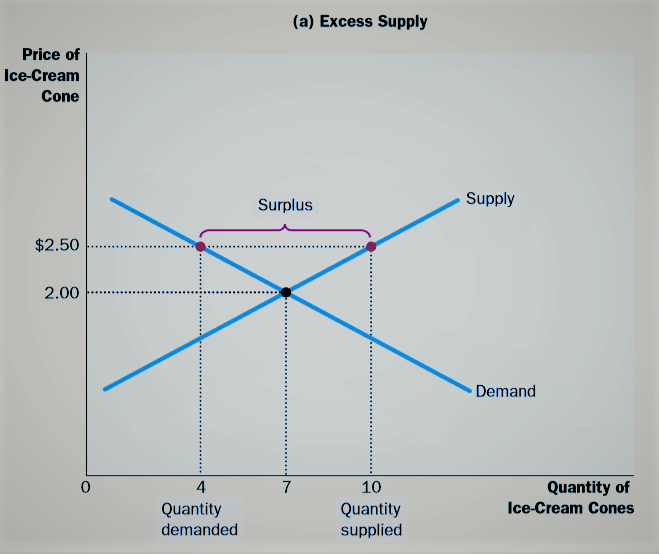
Suppose first that the market price is above the equilibrium price, as in the image below.

There is a surplus of supply. Because the market price of $2.50 is above the equilibrium price, the quantity supplied (10 cones) exceeds the quantity demanded (4 cones). Suppliers try to increase sales by cutting the price of a cone, and this moves the price toward its equilibrium level.
At a price of $2.50 per cone, the quantity of the good supplied (10 cones) exceeds the quantity demanded (4 cones). There is a surplus of the good: Suppliers are unable to sell all they want at the going price.
When there is a surplus in the ice-cream market, for instance, sellers of ice cream find their freezers increasingly full of ice cream they would like to sell but cannot. They respond to the surplus by cutting their prices.
Prices continue to fall until the market reaches the equilibrium.
Example Two
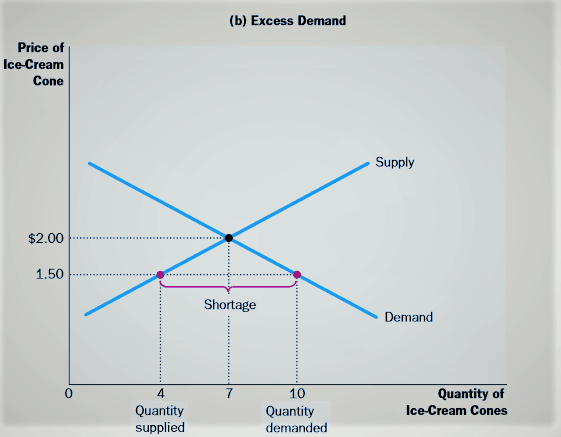
Suppose now that the market price is below the equilibrium price, as in chart below.

In this case, the price is $1.50 per cone, and the quantity of the good demanded exceeds the quantity supplied.
There is a shortage of the good: Demanders are unable to buy all they want at the going price.
When a shortage occurs in the ice-cream market, for instance, buyers have to wait in long lines for a chance to buy one of the few cones that are available.
With too many buyers chasing too few goods (Scarcity), sellers can respond to the shortage by raising their prices without losing sales. As prices rise, the market once again moves toward the equilibrium.
Thus, the activities of the many buyers and sellers automatically push the market price toward the equilibrium price.
Once the market reaches its equilibrium, all buyers and sellers are satisfied, and there is no upward or downward pressure on the price.
How quickly equilibrium is reached varies from market to market, depending on how quickly prices adjust.
In most free markets, however, surpluses and shortages are only temporary because prices eventually move toward their equilibrium levels.
Indeed, this phenomenon is so pervasive that it is sometimes called the law of supply and demand.
The price of any good adjusts to bring the supply and demand for that good into balance.
Okay, on finish note
The equilibrium is found where the supply and demand curves intersect. At the equilibrium price, the quantity supplied equals the quantity demanded (and vice versa).
