So far we have seen how supply and demand together determine a market’s equilibrium, which in turn determines the price of the good and the amount of the good that buyers purchase and sellers produce.
Of course, the equilibrium price and quantity depend on the position of the supply and demand curves.
When some event shifts one of these curves, the equilibrium in the market changes.
The analysis of such a change is called comparative statics because it involves comparing two static situations. An old and a new equilibrium.
When analyzing how some event affects a market, we proceed in three steps.
First, we decide whether the event shifts the supply curve, the demand curve, or in some cases both curves.
Second, we decide whether the curve shifts to the right or to the left.
Third, we use the supply-and-demand diagram to examine how the shift affects the equilibrium price and quantity.
Analyzing Changes in Equilibrium
To see how this recipe is used, let’s consider various events that might affect the market and changes in Equilibrium for ice cream to Analyzing Changes in Equilibrium
1 A Change in Demand
Suppose that one summer the weather is very hot. How does this event affect the market for ice cream? To answer this question, let’s follow our three steps.
- The hot weather affects the demand curve by changing people’s taste for ice cream. That is, the weather changes the amount of ice cream that people want to buy at any given price. The supply curve is unchanged because the weather does not directly affect the firms that sell ice cream.
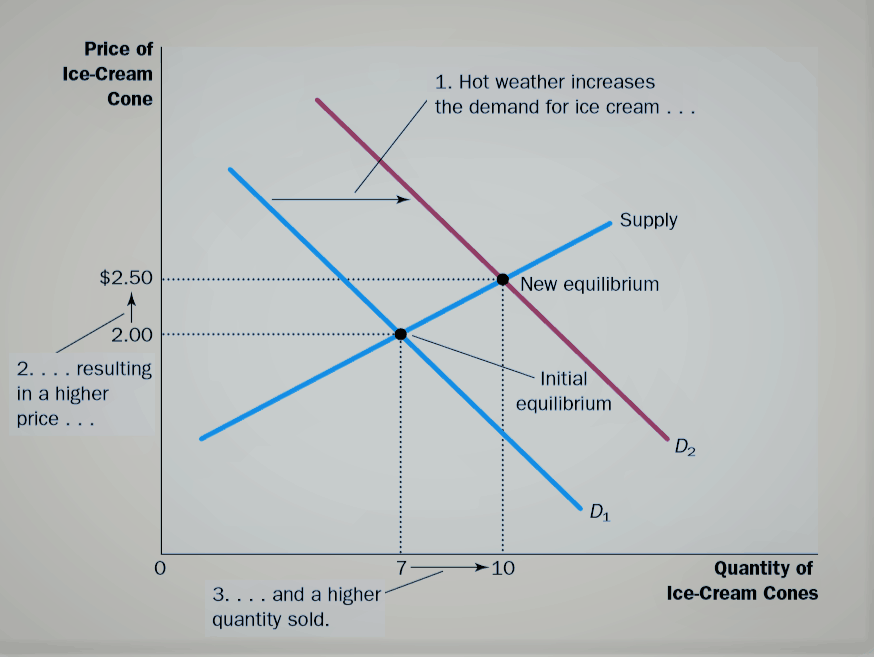
- Because hot weather makes people want to eat more ice cream, the demand curve shifts to the right. Figure 4-10 shows this increase in demand as the shift in the demand curve from D1 to D2. This shift indicates that the quantity of ice cream demanded is higher at every price.
- As the graph below shows, the increase in demand raises the equilibrium price from $2.00 to $2.50 and the equilibrium quantity from 7 to 10 cones.
- In other words, the hot weather increases the price of ice cream and the quantity of ice cream sold.

A Change in Demand
Shifts in Curves versus Movements along Curves
Notice that when hot weather drives up the price of ice cream, the quantity of ice cream that firms supply rises, even though the supply curve remains the same.
In this case, economists say there has been an increase in “quantity supplied” but no change in “supply.”
“Supply” refers to the position of the supply curve, whereas the “quantity supplied” refers to the amount suppliers wish to sell.
In this example, supply does not change because the weather does not alter firms’ desire to sell at any given price.
Instead, the hot weather alters consumers’ desire to buy at any given price and thereby shifts the demand curve.
The increase in demand causes the equilibrium price to rise. When the price rises, the quantity supplied rises. This increase in quantity supplied is represented by the movement along the supply curve.
To summarize, a shift in the supply curve is called a “change in supply,” and a shift in the demand curve is called a “change in demand.”
A movement along a fixed supply curve is called a “change in the quantity supplied,” and a movement along a fixed demand curve is called a “change in the quantity demanded.”
2 A Change in Supply
Suppose that, during another summer, an earthquake destroys several ice-cream factories. How does this event affect the market for ice cream? Once again, to answer this question, we follow our three steps.

- The earthquake affects the supply curve. By reducing the number of sellers, the earthquake changes the amount of ice cream that firms produce and sell at any given price.
- The demand curve is unchanged because the earthquake does not directly change the amount of ice cream households wish to buy.
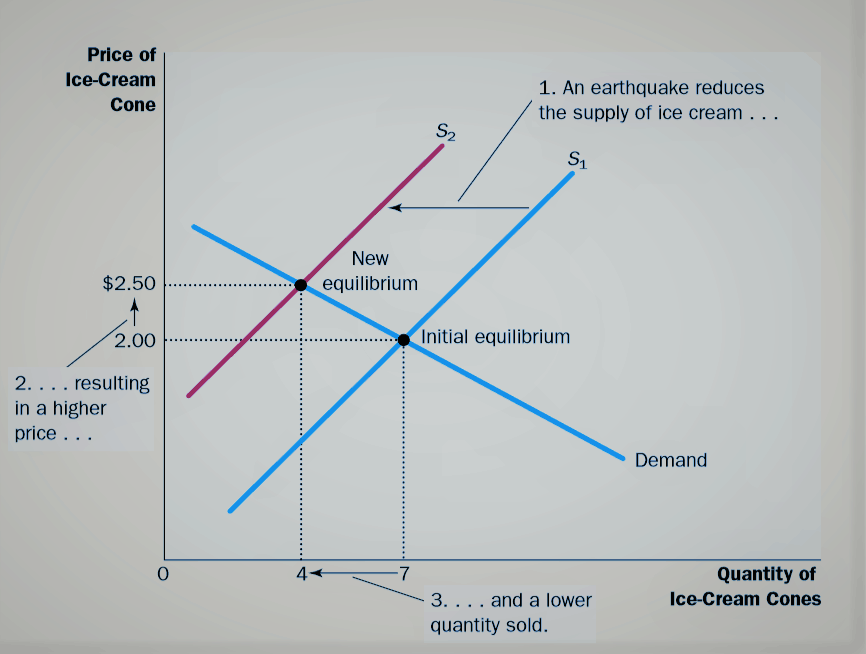
- The supply curve shifts to the left because, at every price, the total amount that firms are willing and able to sell is reduced. The graph below illustrates this decrease in supply as a shift in the supply curve from S1 to S2.
- As the graph shows, the shift in the supply curve raises the equilibrium price from $2.00 to $2.50 and lowers the equilibrium quantity from 7 to 4 cones. As a result of the earthquake, the price of ice cream rises, and the quantity of ice cream sold falls.
3 A Change in Both Supply and Demand
Now suppose that the hot weather and the earthquake
- We determine that both curves must shift. The hot weather affects the demand curve because it alters the amount of ice cream that households want to buy at any given price. At the same time, the earthquake alters the supply curve because it changes the amount of ice cream that firms want to sell at any given price.
- The curves shift in the same directions as they did in our previous analysis. The demand curve shifts to the right, and the supply curve shifts to the left. The first graph below illustrates these shifts.
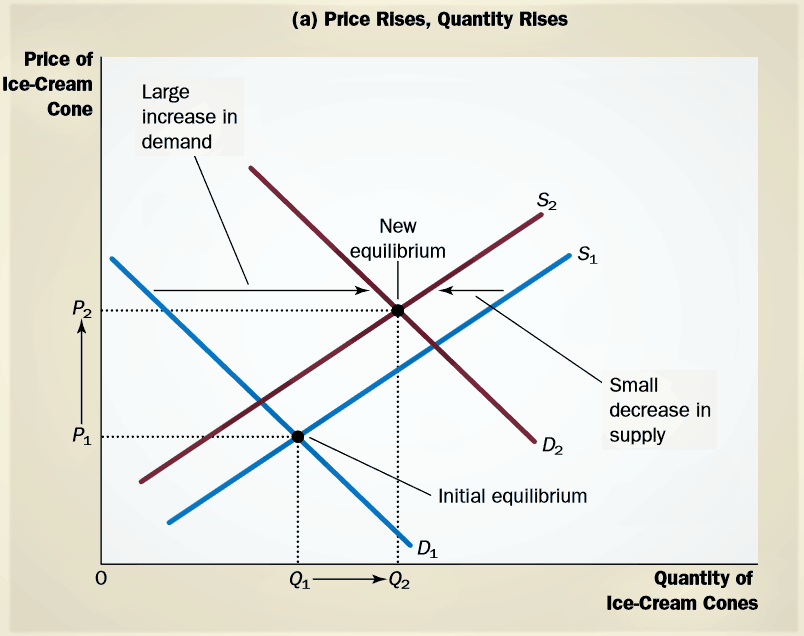
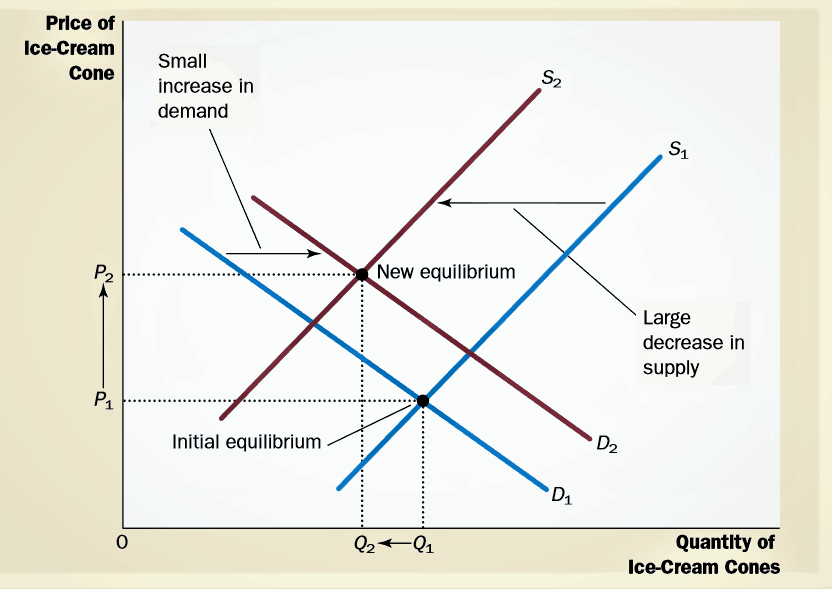
- As 2 graphs a and b below show, there are two possible outcomes that might result, depending on the relative size of the demand and supply shifts. In both cases, the equilibrium price rises. In panel
- (a), where demand increases substantially while supply falls just a little, the equilibrium quantity also rises.
- (b), where supply falls substantially while demand rises just a little, the equilibrium quantity falls.
Thus, these events certainly raise the price of ice cream, but their impact on the amount of ice cream sold is ambiguous.


Summary Changes in Equilibrium
We have just seen three examples of how to use supply and demand curves to analyze changes in equilibrium.
Whenever an event shifts the supply curve, the demand curve, or perhaps both curves. you can use these tools to predict how the event will alter the amount sold in equilibrium and the price at which the good is sold.
As the table above shows the predicted outcome for any combination of shifts in the two curves.
To make sure you understand how to use the tools of supply and demand, pick a few entries in this table and make sure you can explain to yourself why the table contains the prediction it does.
