The production possibilities frontier (PPF) is a curve that shows the various combinations of output that the economy can possibly produce for two Goods, given the available factors of production and the available production technology.
Table of contents
Understanding Production Possibilities
Although real economies produce thousands of goods and services. Let’s
Both, the Car industry and the computer industry use all the economy’s factors of production.
The production possibilities frontier is a graph that shows the various combinations of output.
In this case, cars and computers.
That the economy produce given the available factors of production and the available production technology that firms can use to turn these factors into an output.

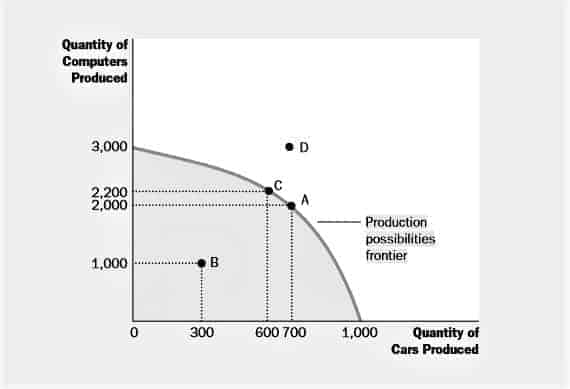
Above graph is an example of a production possibilities frontier curve.
In this economy, if all resources were used in the car industry, the economy would produce 1,000 cars and no computers. If all resources were used in the computer industry, the economy would produce 3,000 computers and no cars.
The two endpoints of the production possibilities frontier represent these extreme possibilities.
If the economy were to divide its resources between the two industries. It could produce 700 cars and 2,000 computers, shown in the graph above by point A.
By contrast, the outcome at point D is not possible because resources are scarce. The economy does not have enough of the factors of production to support that level of output.
In other words, the economy can produce at any point on or inside the production possibilities frontier. But it cannot produce at points outside the frontier.
An outcome is efficient if the economy is getting all it can from the scarce resources it has available. Points on (rather than inside) the production possibilities frontier represent efficient levels of production.
When the economy is producing at such a point, say point A, there is no way to produce more of one good without producing less of the other.
Point B represents an inefficient outcome for some reason. Perhaps, widespread unemployment, the economy is producing less than it could from the resources it has available.
It is producing only 300 cars and 1,000 computers. If the source of the inefficiency were eliminated, the economy could move from point B to point A.
Increasing production of both cars (to 700) and computers (to 2,000).
One of the Ten Principles of Economics is that people face tradeoffs. The production possibilities frontier shows one tradeoff that society faces.
Once we have reached the efficient points on the frontier, the only way of getting more of one good is to get less of the other. When the economy moves from point A to point C, for instance, society produces more computers but at the expense of producing fewer cars.
Another Principles of Economics is that the cost of something is what you give up to get it. This is called the opportunity cost.
The production possibilities frontier shows the opportunity cost of one good as measured in terms of the other good.
When society reallocates some of the factors of production from the car industry to the computer industry, moving the economy from point A to point C, it gives up 100 cars to get 200 additional computers.
In other words, when the economy is at point A, the opportunity cost of 200 computers is 100 cars.
Notice that the production possibilities frontier in the above graph is bowed outward. This means that the opportunity cost of cars in terms of computers depends on how much of each good the economy is producing.
When the economy is using most of its resources to make cars, the production possibilities frontier is quite steep.
Because even workers and machines best suited to making computers are being used to make cars. The economy gets a substantial increase in the number of computers for each car it gives up.
By contrast, when the economy is using most of its resources to make computers, the production possibilities frontier is quite flat.
In this case, the resources best suited to making computers are already in the computer industry. And, each car the economy gives up yields only a small increase in the number of computers.
The production possibilities frontier shows the tradeoff between the production of different goods at a given time. But the tradeoff can change over time.
For example,
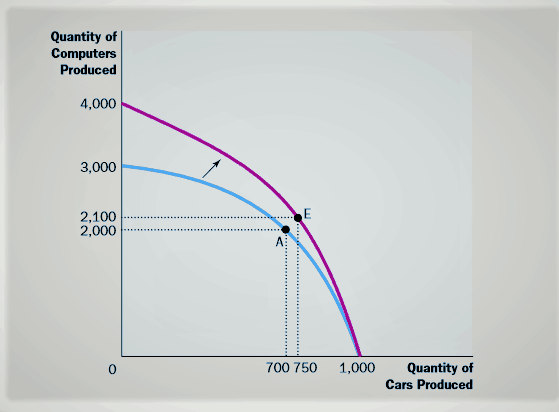
If a technological advance in the computer industry raises the number of computers that a worker can produce per week. The economy can make more computers for any given number of cars.
As a result, the production possibilities frontier shifts outward. As shown in the graph below.

Because of this economic growth, society might move production from point A to point E.
Enjoying more computers and more cars.
The production possibilities frontier simplifies a complex economy to highlight and clarify some basic ideas. Like scarcity, efficiency, tradeoffs, opportunity cost, and economic growth.
As you study economics, these ideas will recur in various forms. The production possibilities frontier offers one simple way of thinking about them.
Production Possibilities frontier Examples
Suppose that the farmer and the rancher each work 40 hours a week and can devote this time to growing potatoes, raising cattle, or a combination of the two. The table below shows the amount of time each person requires to produce 1 pound of each good.

The farmer can produce a pound of potatoes in 10 hours and a pound of meat in 20 hours. The rancher, who is more productive in both activities, can produce a pound of potatoes in 8 hours and a pound of meat in 1 hour.

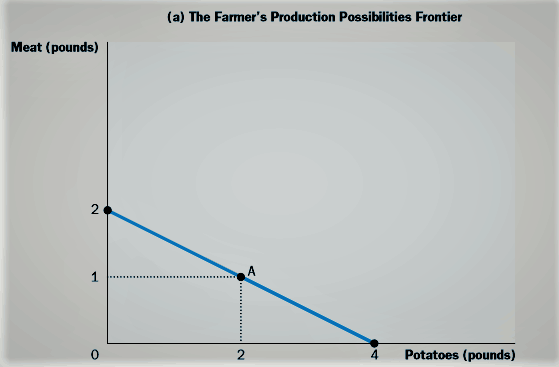
The graph above demonstrates the amounts of meat and potatoes that the farmer can produce.
If the farmer devotes all 40 hours of his time to potatoes, he produces 4 pounds of potatoes and no meat. If he devotes all his time to meat production, he produces 2 pounds of meat and no potatoes.
If the farmer divides his time equally between the two activities, spending 20 hours on each. He produces 2 pounds of potatoes and 1 pound of meat.
The figure shows these three possible outcomes and all others in between.
This graph is the farmer’s production possibilities frontier. As we discussed above, a production possibilities frontier shows the various mixes of output that an economy can produce.
It illustrates one of the Ten Principles of Economics, People face trade offs.
Here the farmer faces a trade off between producing meat and producing potatoes. The trade off between the two goods depends on the amounts being produced.
Here, however, the farmer’s technology for producing meat and potatoes (as summarized in the above graph) allows him to switch between one good and the other at a constant rate. In this case, the production possibilities frontier is a straight line.

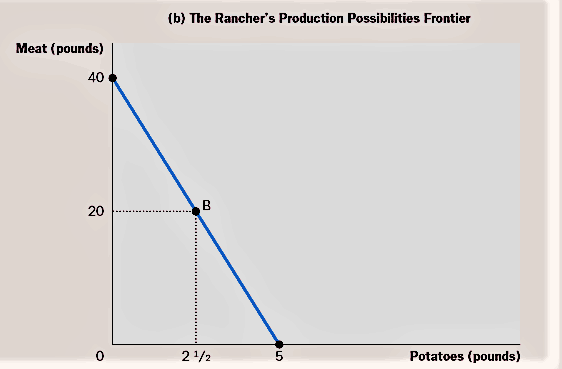
This graph shows the production possibilities frontier for the rancher.
If the rancher devotes all 40 hours of her time to potatoes, she produces 5 pounds of potatoes and no meat.
If she devotes all her time to
If the rancher divides her time equally, spending 20 hours on each activity, she produces 2 1/2 pounds of potatoes and 20 pounds of meat. Once again, the production possibilities frontier shows all the possible outcomes.
If the farmer and rancher choose to be self-sufficient, rather than trade with each other, then each consumes exactly what he or she produces.
In this case, the production possibilities frontier is also the consumption possibilities frontier. That is, without trade, Both graphs in this example shows the possible combinations of meat and potatoes that the farmer and rancher can each consume.
Although these production possibilities frontiers are useful in showing the tradeoffs that the farmer and rancher face.
They do not tell us what the farmer and rancher will actually choose to do. To determine their choices, we need to know the tastes of the farmer and the rancher.
Let’s suppose they choose the combinations identified by points A and B is shown in both graphs. The farmer produces and consumes 2 pounds of potatoes and 1 pound of meat.
While the rancher produces and consumes 2 1/2 pounds of potatoes and 20 pounds of meat.
