Circular flow Diagram is a visual model of the economy that shows how dollars flows through markets among households and firms.
Breaking down Circular Flow Diagram
The economy consists of millions of people engaged in many activities—buying, selling, working, hiring, manufacturing, and so on.
To understand how the economy works, we must find some way to simplify our thinking about all these activities.
In other words,
We need a model that explains, in general terms, how the economy is organized and how participants in the economy interact with one another.

Above Diagram presents a visual model of the economy, called a circular flow diagram. In this model, the economy has two types of decisionmakers—households and firms.
Firms produce goods and services using inputs, such as labor, land, and capital (buildings and machines). These inputs are called the factors of production.
Households own the factors of production and consume all the goods and services that the firms produce.
Households and firms interact in two types of markets.
In the markets for goods and services, households are buyers and firms are sellers. In particular, households buy the output of goods and services that firms produce.
In the markets for the factors of production, households are sellers and firms are buyers. In these markets, households provide firms the inputs that the firms use to produce goods and services.
The circular flow diagram offers a simple way of organizing all the economic transactions that occur between households and firms in the economy.
The inner loop of the circular-flow diagram represents the flows of goods and services between households and firms.
The households sell the use of their labor, land, and capital to the firms in the markets for the factors of production.
The firms then use these factors to produce goods and services, which in turn are sold to households in the markets for goods and services.
Hence, the factors of production flow from households to firms, and goods and services flow from firms to households.
The outer loop of the circular-flow diagram represents the corresponding flow of dollars. The households spend money to buy goods and services from the firms.
The firms use some of the revenue from these sales to pay for the factors of production, such as the wages of their workers.
What’s left is the profit of the firm owners, who themselves are members of households.
Hence, spending on goods and services flows from households to firms, and income in the form of wages, rent, and profit flows from firms to households.
Example of Circular Flow Diagram
Let’s take a tour of the circular flow by following a dollar bill as it makes its way from person to person through the economy.
Imagine that the dollar begins at a household, sitting in, say, your wallet.
If you want to buy a cup of coffee, you take the dollar to one of the economy’s markets for goods and services, such as your local Starbucks coffee shop.

There you spend it on your favorite drink. When the dollar moves into the Starbucks cash register, it becomes revenue for the firm.
The dollar doesn’t stay at Starbucks for long, however, because the firm uses it to buy inputs in the markets for the factors of production.
For instance, Starbucks might use the dollar to pay rent to its landlord for the space it occupies or to pay the wages of its workers. In either case, the dollar enters the income of some household and, once again, is back in someone’s wallet.
At that point, the story of the economy’s circular flow starts once again.
Realistic Circular flow diagram
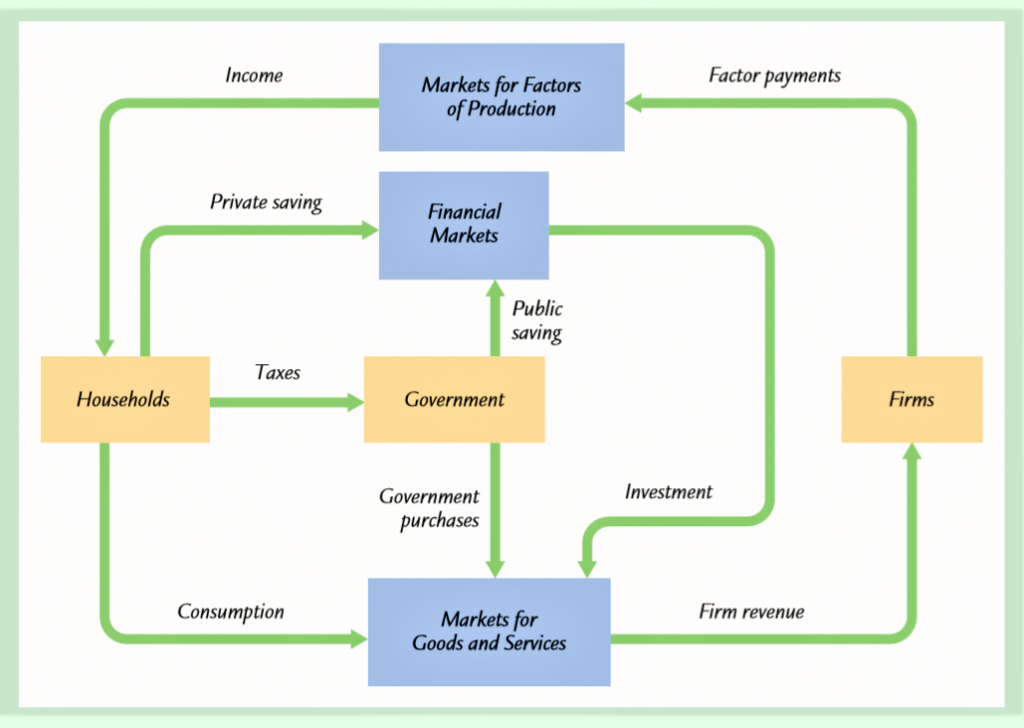
The image below more accurately reflects how real economies function.

It shows the linkages among the economic actors—households, firms, and the government. And how dollars flow among them through the various markets in the economy.
Let’s look at the flow of dollars from the viewpoints of these economic actors.
Households receive income and use it to pay taxes to the government to consume goods and services, and to save through the financial markets.
Firms receive revenue from the sale of goods and services and use it to pay for the factors of production.
Both households and firms borrow in financial markets to buy investment goods, such as houses and factories.
The government receives revenue from taxes and uses it to pay for government purchases. Any excess of tax revenue over government spending is called public saving, which can be either positive (a budget surplus) or negative (a budget deficit).
Summary
The above circular flow diagram in Figure is one simple model of the economy. It dispenses with details that, for some purposes, are significant.
A more complex and realistic circular-flow model would include, for instance, the roles of government and international trade.
Yet these details are not crucial for a basic understanding of how the economy is organized.
Because of its simplicity, this circular flow diagram is useful to keep in mind when thinking about how the pieces of the economy fit together.
